Condo to Freehold in Brantford: Why Timing Your Sale Matters
Deciding when to sell your condo can feel like a strategic game of chess, especially if your end goal is to “upgrade” to a freehold home. With Brantford’s real estate market showing strong correlations between condo and freehold prices, the timing of your sale can significantly impact your buying power. Waiting for condo prices to rise might seem smart, but could it cost you more when freehold prices increase? Let’s break down the geek stuff to uncover the best strategy for your move.
Matt’s Stats
- Correlation: Freehold and condo prices in Brantford show a strong 97% positive correlation over the years.
- Price Sensitivity: Condo prices are more volatile than freeholds, responding sharply to market shifts.
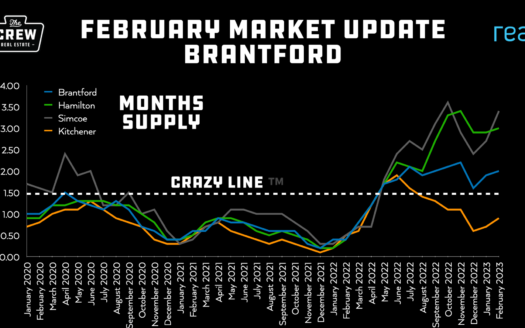
- Months of Inventory: A crucial indicator of market conditions, calculated as active listings divided by monthly sales.
The Raw Data: Average Price, CDOM, Sales and more for Condos and Freehold Properties in Brantford
| Month | Average Price_Condo | Sales Count_Condo | Active Listings_Condo | Median Price_Condo | Average Price_Freehold | CDOM_Condo | Sales Count_Freehold | Active Listings_Freehold | Median Price_Freehold | CDOM_Freehold | |
|---|---|---|---|---|---|---|---|---|---|---|---|
| Jan 2020 | $327,950.00 | 14 | 34 | $316,950.00 | $452,545.00 | 43 | 91 | 122 | $428,000.00 | 49 | |
| Feb 2020 | $328,576.00 | 17 | 30 | $313,000.00 | $463,997.00 | 42 | 97 | 118 | $440,000.00 | 41 | |
| Mar 2020 | $287,189.00 | 18 | 31 | $272,500.00 | $486,453.00 | 32 | 126 | 148 | $467,500.00 | 26 | |
| Apr 2020 | $310,179.00 | 9 | 30 | $300,111.00 | $465,674.00 | 27 | 67 | 176 | $450,000.00 | 23 | |
| May 2020 | $316,895.00 | 17 | 32 | $305,000.00 | $454,869.00 | 42 | 118 | 144 | $433,500.00 | 31 | |
| Jun 2020 | $316,497.00 | 29 | 28 | $309,900.00 | $505,288.00 | 30 | 161 | 144 | $510,000.00 | 30 | |
| Jul 2020 | $343,248.00 | 29 | 27 | $330,000.00 | $543,432.00 | 35 | 180 | 130 | $515,000.00 | 24 | |
| Aug 2020 | $390,450.00 | 22 | 34 | $359,000.00 | $534,753.00 | 28 | 167 | 151 | $510,000.00 | 17 | |
| Sep 2020 | $353,594.00 | 35 | 21 | $337,000.00 | $527,926.00 | 22 | 173 | 133 | $510,000.00 | 16 | |
| Oct 2020 | $348,330.00 | 28 | 16 | $317,500.00 | $540,196.00 | 16 | 187 | 86 | $520,000.00 | 16 | |
| Nov 2020 | $375,124.00 | 25 | 11 | $360,000.00 | $546,733.00 | 20 | 137 | 72 | $530,000.00 | 16 | |
| Dec 2020 | $326,990.00 | 10 | 4 | $290,000.00 | $558,076.00 | 13 | 87 | 47 | $561,000.00 | 14 | |
| Jan 2021 | $417,472.00 | 7 | 8 | $382,000.00 | $617,289.00 | 7 | 99 | 51 | $599,900.00 | 19 | |
| Feb 2021 | $420,835.00 | 17 | 12 | $390,000.00 | $678,016.00 | 7 | 146 | 73 | $655,760.00 | 10 | |
| Mar 2021 | $459,851.00 | 22 | 18 | $435,500.00 | $654,927.00 | 8 | 187 | 91 | $620,000.00 | 8 | |
| Apr 2021 | $465,638.00 | 29 | 18 | $445,000.00 | $646,666.00 | 17 | 202 | 135 | $615,000.00 | 9 | |
| May 2021 | $454,678.00 | 30 | 18 | $443,000.00 | $673,256.00 | 14 | 218 | 129 | $631,050.00 | 12 | |
| Jun 2021 | $433,747.00 | 26 | 23 | $432,500.00 | $656,856.00 | 17 | 183 | 134 | $650,000.00 | 13 | |
| Jul 2021 | $474,853.00 | 15 | 23 | $470,000.00 | $672,854.00 | 13 | 146 | 103 | $647,450.00 | 16 | |
| Aug 2021 | $482,245.00 | 22 | 22 | $475,000.00 | $693,036.00 | 26 | 131 | 92 | $670,501.00 | 16 | |
| Sep 2021 | $493,120.00 | 28 | 34 | $468,400.00 | $679,480.00 | 9 | 140 | 92 | $660,516.00 | 13 | |
| Oct 2021 | $465,806.00 | 31 | 24 | $430,000.00 | $705,685.00 | 20 | 144 | 78 | $674,400.00 | 16 | |
| Nov 2021 | $471,475.00 | 20 | 11 | $466,500.00 | $766,003.00 | 16 | 133 | 54 | $735,000.00 | 12 | |
| Dec 2021 | $493,187.00 | 11 | 7 | $480,000.00 | $777,621.00 | 40 | 77 | 19 | $715,500.00 | 14 | |
| Jan 2022 | $496,192.00 | 13 | 8 | $495,000.00 | $855,661.00 | 25 | 106 | 50 | $825,500.00 | 10 | |
| Feb 2022 | $530,195.00 | 22 | 9 | $505,000.00 | $863,092.00 | 13 | 163 | 63 | $825,000.00 | 8 | |
| Mar 2022 | $579,348.00 | 31 | 15 | $558,600.00 | $847,155.00 | 7 | 140 | 123 | $800,000.00 | 9 | |
| Apr 2022 | $569,762.00 | 21 | 20 | $585,000.00 | $792,656.00 | 11 | 171 | 166 | $760,000.00 | 9 | |
| May 2022 | $597,556.00 | 18 | 35 | $572,500.00 | $750,556.00 | 17 | 127 | 229 | $710,000.00 | 14 | |
| Jun 2022 | $523,340.00 | 10 | 48 | $501,750.00 | $693,237.00 | 21 | 138 | 235 | $660,000.00 | 19 | |
| Jul 2022 | $569,431.00 | 16 | 47 | $535,000.00 | $667,664.00 | 36 | 83 | 252 | $655,000.00 | 25 | |
| Aug 2022 | $490,993.00 | 15 | 59 | $470,000.00 | $703,935.00 | 28 | 95 | 236 | $670,000.00 | 33 | |
| Sep 2022 | $481,762.00 | 26 | 60 | $474,500.00 | $648,754.00 | 43 | 92 | 231 | $619,000.00 | 38 | |
| Oct 2022 | $450,500.00 | 17 | 54 | $475,000.00 | $640,140.00 | 59 | 66 | 216 | $617,500.00 | 38 | |
| Nov 2022 | $441,950.00 | 10 | 53 | $453,000.00 | $627,715.00 | 57 | 61 | 191 | $625,000.00 | 38 | |
| Dec 2022 | $452,938.00 | 13 | 40 | $450,000.00 | $603,082.00 | 49 | 57 | 137 | $600,000.00 | 42 | |
| Jan 2023 | $524,462.00 | 13 | 49 | $538,000.00 | $673,461.00 | 82 | 62 | 149 | $653,500.00 | 37 | |
| Feb 2023 | $453,822.00 | 18 | 56 | $412,500.00 | $643,005.00 | 26 | 82 | 160 | $617,500.00 | 48 | |
| Mar 2023 | $475,307.00 | 29 | 51 | $429,000.00 | $682,796.00 | 42 | 106 | 172 | $650,000.00 | 34 | |
| Apr 2023 | $471,936.00 | 25 | 39 | $480,000.00 | $678,565.00 | 67 | 133 | 170 | $668,000.00 | 36 | |
| May 2023 | $563,091.00 | 22 | 52 | $565,100.00 | $735,971.00 | 53 | 156 | 195 | $710,500.00 | 21 | |
| Jun 2023 | $507,130.00 | 30 | 55 | $499,500.00 | $686,059.00 | 51 | 132 | 242 | $660,500.00 | 21 | |
| Jul 2023 | $481,027.00 | 20 | 42 | $450,500.00 | $701,015.00 | 31 | 99 | 286 | $650,000.00 | 26 | |
| Aug 2023 | $515,571.00 | 14 | 48 | $496,000.00 | $663,537.00 | 52 | 119 | 257 | $630,000.00 | 42 | |
| Sep 2023 | $505,417.00 | 18 | 59 | $492,000.00 | $669,464.00 | 42 | 81 | 288 | $660,000.00 | 44 | |
| Oct 2023 | $463,809.00 | 12 | 68 | $456,200.00 | $685,902.00 | 59 | 105 | 279 | $681,000.00 | 45 | |
| Nov 2023 | $398,154.00 | 13 | 63 | $365,000.00 | $631,767.00 | 47 | 68 | 250 | $592,500.00 | 48 | |
| Dec 2023 | $489,975.00 | 8 | 50 | $427,500.00 | $683,291.00 | 61 | 53 | 173 | $635,000.00 | 44 | |
| Jan 2024 | $497,742.00 | 12 | 59 | $505,000.00 | $665,452.00 | 85 | 63 | 185 | $615,000.00 | 62 | |
| Feb 2024 | $504,394.00 | 18 | 56 | $537,500.00 | $644,167.00 | 69 | 78 | 201 | $637,000.00 | 52 | |
| Mar 2024 | $472,992.00 | 19 | 61 | $425,000.00 | $637,390.00 | 59 | 105 | 211 | $615,000.00 | 37 | |
| Apr 2024 | $508,728.00 | 18 | 76 | $480,000.00 | $688,871.00 | 90 | 135 | 234 | $663,500.00 | 31 | |
| May 2024 | $465,250.00 | 18 | 82 | $486,000.00 | $649,569.00 | 71 | 118 | 267 | $629,050.00 | 36 | |
| Jun 2024 | $497,313.00 | 16 | 82 | $494,950.00 | $669,805.00 | 44 | 112 | 285 | $641,750.00 | 31 | |
| Jul 2024 | $439,235.00 | 20 | 82 | $425,000.00 | $660,666.00 | 92 | 89 | 333 | $622,500.00 | 33 | |
| Aug 2024 | $418,527.00 | 11 | 92 | $379,900.00 | $633,487.00 | 60 | 103 | 317 | $612,000.00 | 38 | |
| Sep 2024 | $466,132.00 | 19 | 95 | $405,000.00 | $653,418.00 | 54 | 85 | 341 | $645,000.00 | 48 | |
| Oct 2024 | $520,867.00 | 15 | 107 | $450,000.00 | $666,584.00 | 61 | 96 | 339 | $617,500.00 | 49 | |
| Nov 2024 | $496,292.00 | 14 | 94 | $492,500.00 | $677,707.00 | 105 | 94 | 261 | $657,000.00 | 51 | |
| Dec 2024 | $516,100.00 | 10 | 77 | $560,000.00 | $631,577.00 | 45 | 74 | 194 | $618,750.00 | 71 |
Understanding the Price Correlation Between Brantford Condo and Freehold Properties
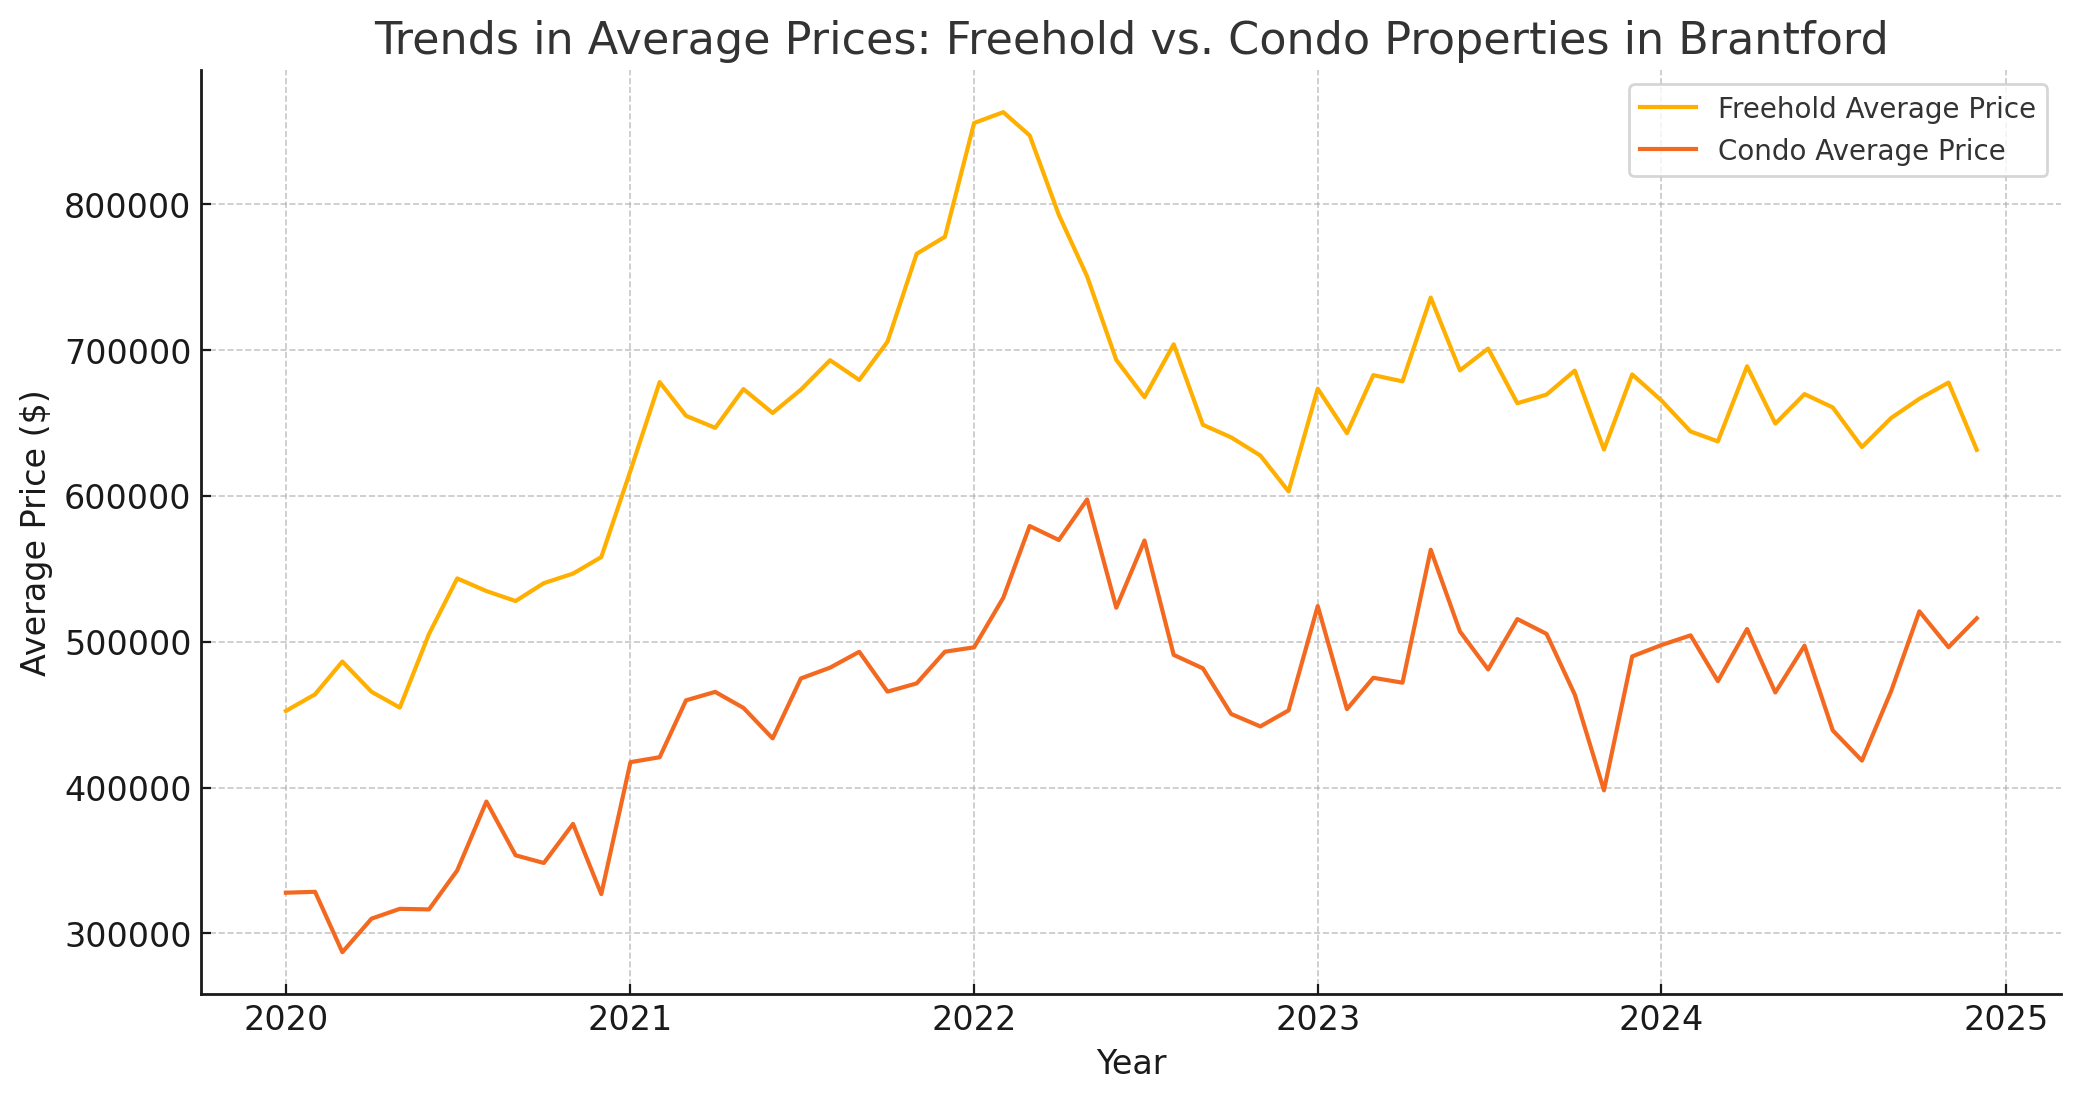
The stats from Brantford’s market demonstrates that when freehold prices rise, condo prices tend to follow suit. This parallel movement is driven by shared market factors, such as interest rates, supply constraints, and buyer demand. While condos are generally more affordable, they are also more sensitive to price changes, which can lead to sharper increases when demand spikes.
For example, during 2021, both freehold and condo prices in Brantford experienced their largest year-over-year increases, fueled by historically low interest rates and tight inventory. However, waiting for condo prices to climb further in such a market often means paying more for the freehold home you plan to buy.
The Cost of Waiting to Move from Condo to Freehold in Brantford
While it’s tempting to wait for condo prices to heat up, here’s the catch: rising freehold prices can outpace the gains in your condo’s value. Let’s illustrate this with some data-driven insights:
- Freehold Premiums: The average price of a freehold home in Brantford in 2023 was approximately $650,000, while condos averaged $450,000. A 5% increase in both markets would add $22,500 to your condo’s value but $32,500 to the cost of the freehold home.
- Months of Inventory: If months of inventory for freeholds is low (e.g., 1-2 months), competition among buyers will likely push prices higher faster. For condos, a higher inventory might stabilize prices temporarily, but the lag won’t last long if demand rises.
For additional insights on price variations across neighbourhoods, check out Brantford Neighbourhood Median Sale Prices and further statistical information from CREA: Understanding Market Trends in Brantford Real Estate.
A Case for Selling Now
Market conditions in Brantford suggest that acting sooner rather than later may be advantageous if you’re planning to transition from a condo to a freehold. Here’s why:
- Lower Freehold Prices: Selling now while freehold prices are relatively stable means you can lock in a more affordable purchase.
- Condos Hold Demand: Brantford’s condo market remains appealing to first-time buyers and downsizers, maintaining solid demand despite price fluctuations.
- Flexibility: By selling your condo sooner, you gain the financial flexibility to act quickly if the right freehold home becomes available.
What the Numbers Say About Timing a Condo to Freehold Move in Brantford
To further illustrate this point, consider the current months of inventory in Brantford:
- Freeholds: 1.5 months (indicative of a seller’s market with rising prices).
- Condos: 3 months (a more balanced market with moderate price increases).
In a seller’s market, the longer you wait, the more likely you are to face higher competition and escalating prices for freehold homes.
If you’re in a similar situation—debating whether to sell your condo to buy a freehold home—I can help you navigate the market with a data-driven approach. Let’s have a chat about what you are looking to do, and we’ll create the best strategy to maximize your buying power.