Predicting Real Estate prices by Months of Inventory
Being a real estate agent, I have to know the importance of market trends and the various factors that impact the real estate industry. One statistic that has historically proven to be a reliable indicator of market trends is the Months of Inventory.
How Can You Determine the Months of Inventory?
The months of inventory is a statistical measurement that determines how long it would take to sell all the current listings if no new listings were added. This metric is also referred to as the absorption rate.
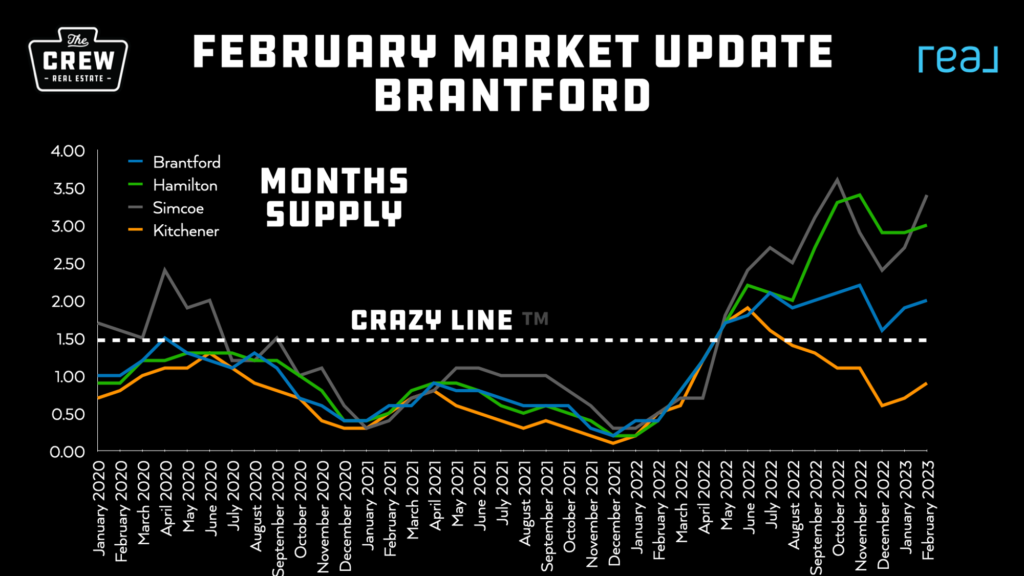
To calculate the months of inventory in any area, you need to divide the total number of active listings by the number of sales in a particular month. For instance, at the time of writing, the number of active single family homes in Brantford is 179, and the number of sales in the last 30 days is 132. The months of inventory would be 1.36 (179/132 = ~1.3560) which is below our 1.5 threshold we lovingly refer to as The Crazy Line
This calculation helps you understand whether the current market is favouring buyers or sellers. A high months of inventory rate means that there is an oversupply of homes, and the market is favourable for buyers. Conversely, a low months of inventory rate indicates that there is a high demand for homes, and the market is favourable for sellers.


The Significance of Months of Inventory
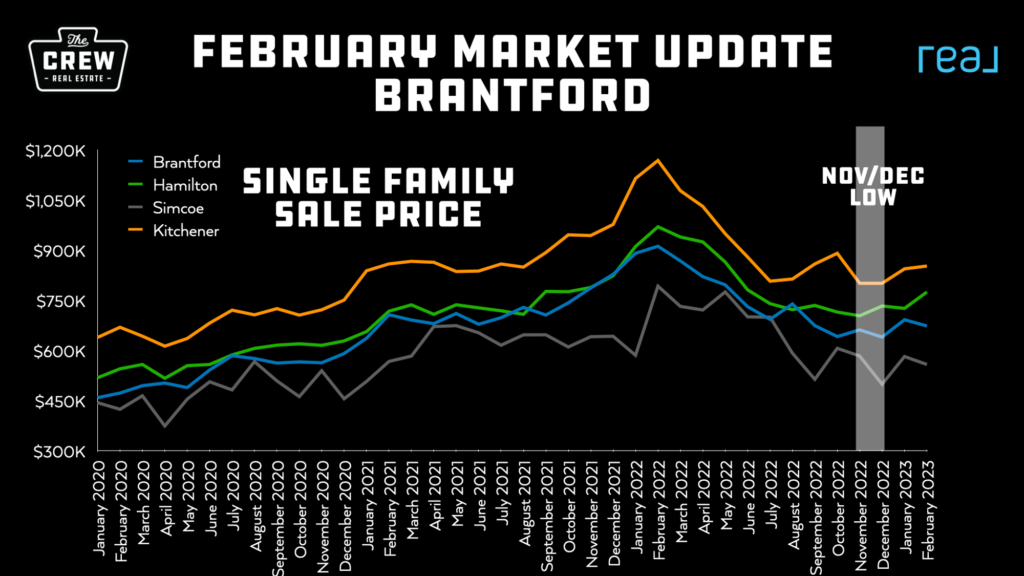
Looking at years of data, when the real estate market in Brantford/Norfolk/Oxford falls to 1.5 months of inventory or lower, average sale prices start to increase at a quicker pace. In January 2022, the MOI in Brantford was below 0.5, which resulted in a surge in average price once fresh listings hit the market. The still low-interest rates at the time contributed to an even more aggressive increase in price.
However, with interest rates now at a higher mark, it is unlikely that prices will pop as aggressively in the future if the MOI stays below 1.5 for an extended period of time. Nonetheless, both buyers and sellers should be keeping an eye on the month over month changes to the months of inventory to get an idea as to where the market is headed.
Why is Months of Inventory Important?
Understanding MOI is crucial for buyers and sellers because it allows them to predict market trends and anticipate changes in average sale prices. A low MOI suggests that there are more buyers than available properties, leading to increased competition and potentially higher prices. A high MOI, on the other hand, suggests that there are more properties available than buyers, resulting in a more significant bargaining power for buyers.
FAQ
- What is the “months of inventory” statistic in real estate?
The “months of inventory” statistic refers to the amount of time it would take for all the current listings in a particular real estate market to sell, assuming no new listings are added. In the Brantford market, a low number of months of inventory typically indicates a seller’s market, where there is more demand for homes than there are homes available for sale. - When does the Brantford market tend to experience an increase in average sale price?
In and around Brantford, when the market falls to 1.5 months of inventory or lower, that is where the “crazy line” sits and average sale price starts to increase at a quicker pace. - How did the Brantford market behave at the beginning of 2022 compared to 2023 in terms of months of inventory and interest rates?
At the start of January 2022, the months of inventory in Brantford was actually below 0.5, which coupled with still low interest rates, caused an aggressive surge in average price once fresh listings started to hit the market. In 2023 we’ve seen the MOI flirt with the 2 months range but have quickly dropped hitting a low of 1.35 in April 2023. As the MOI has dropped, the prices have increased at a slower but steady pace, stifled somewhat by higher interest rates and uncertainty in the economy. - Can we expect prices to increase as aggressively in Brantford now that interest rates have risen?
With interest rates now at a higher mark, it is not expected that prices will pop as aggressively as they did earlier this year, but month over month numbers may still trend upwards. - What should potential buyers and sellers in the Brantford market be looking out for in the coming months?
Buyers and sellers in the Brantford market should be paying attention to the months of inventory statistic and keeping an eye on month over month numbers to gauge the state of the market and make informed decisions about buying or selling.


Pingback:5 Tips for First-Time Homebuyers in Brantford | Matt Allman
Pingback:Hot n Cold: Brantford's Real Estate Market August 2024 | Matt Allman - Brantford Real Estate Agent